The Summary Dashboard is the first screen that a user will see when they log in.
Each user in CX Index has access to their own unique dashboard. The dashboard allows users to view Voice of the Customer data in a range of formats.
Metric gauges
Temperature gauges show the total scores for all metrics the user has selected from the Metric Settings page.
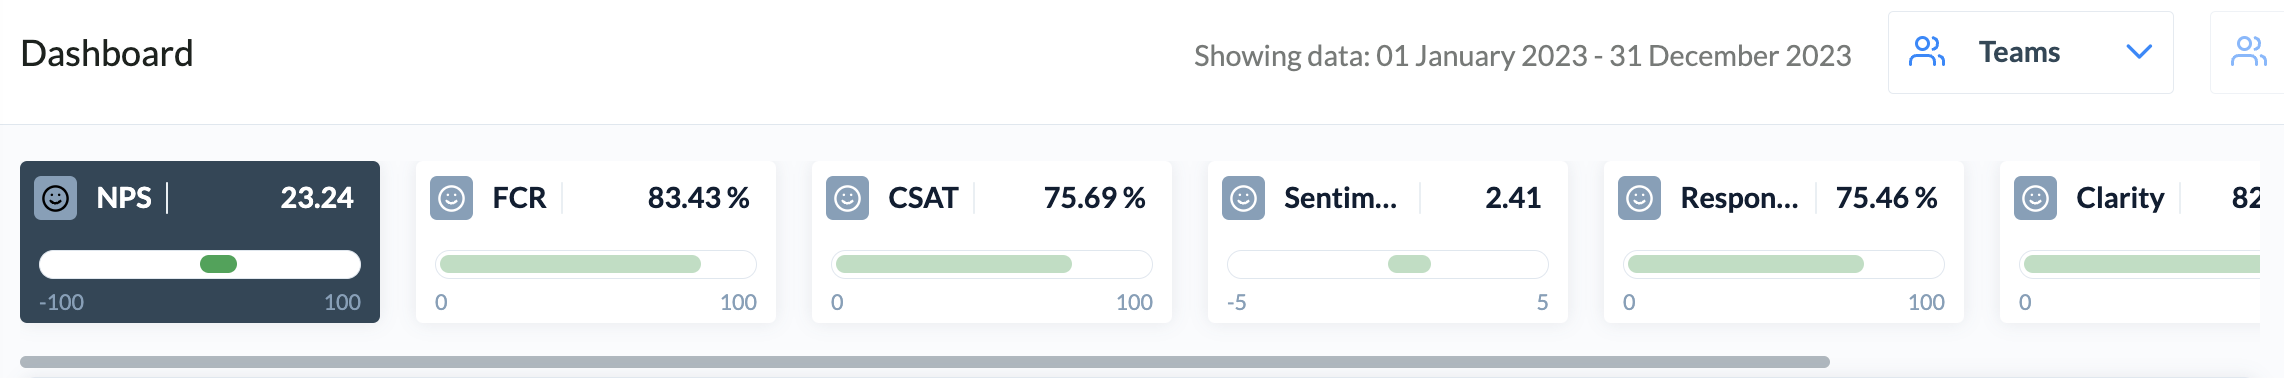
(Move the slider that's beneath the dials sideways to view more metrics).
You can change which dials you see by changing the filters selected on the right side of the page.
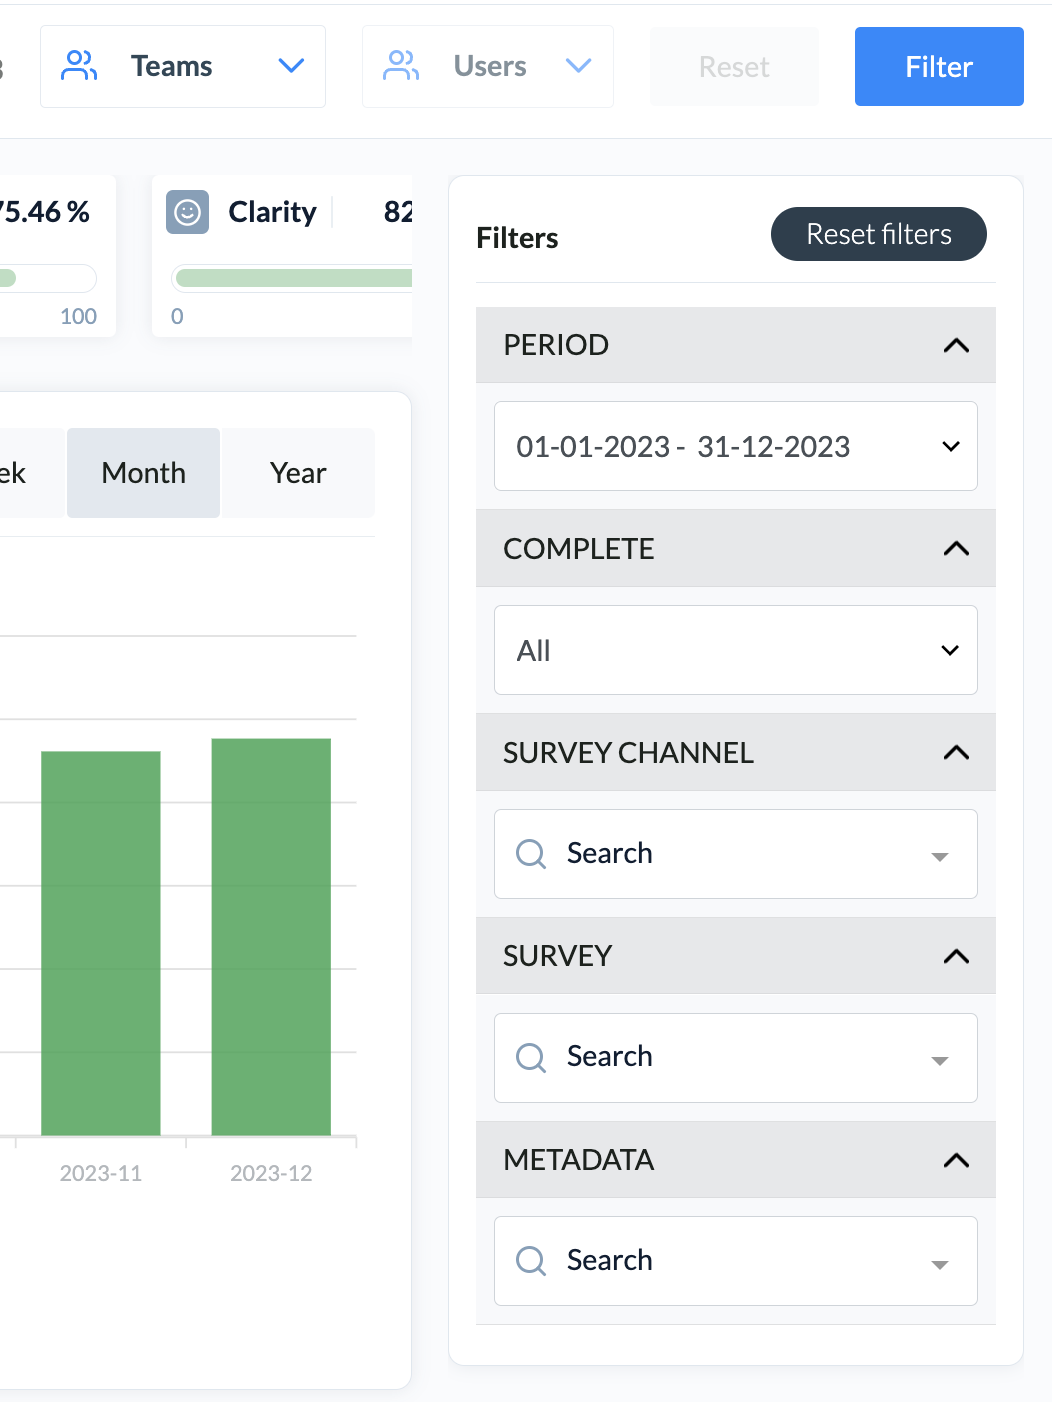
Trend graphs
Trend graphs are used to show performance over time.
By clicking on a metrics dial above, you can choose to display the data as a Bar Graph or a Line Graph. Toggle between the two graph types by clicking on the name of the graph displayed. The default view is the Bar Graph.
Click on the Day/Week/Month buttons beneath the graph to change the data periods presented.
To download the displayed graph, click on the three lines at the top right corner of the graph and select your preferred download option (SVG, PNG, CSV).
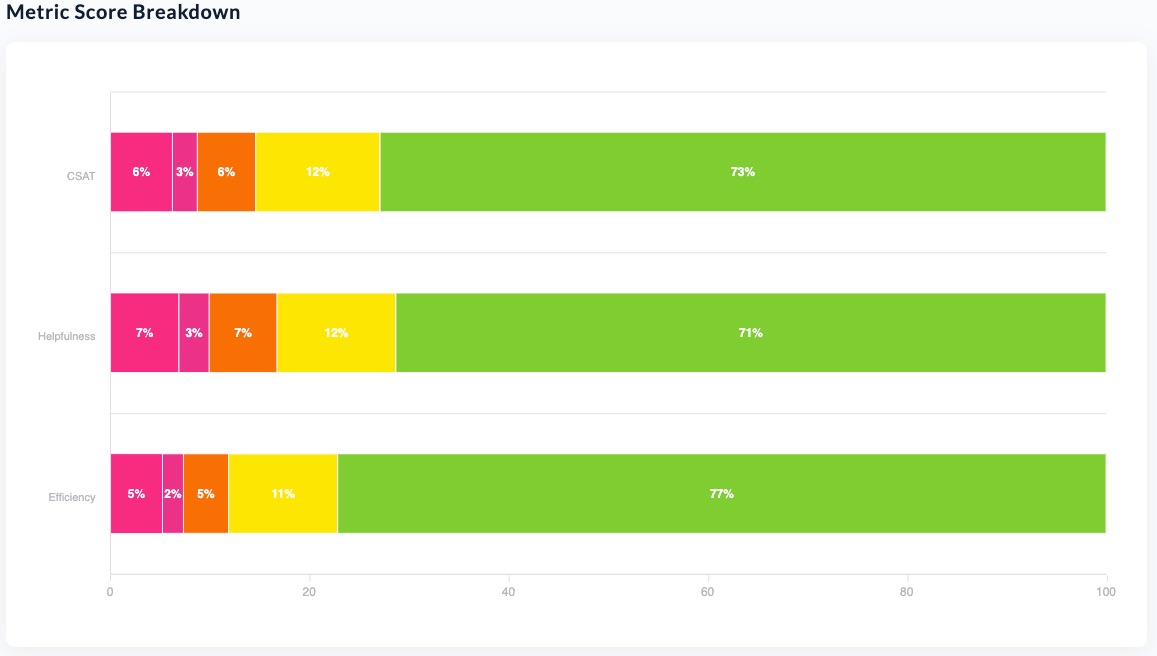
Metric Score breakdown
This section shows the breakdown of scores across surveys, showing the percentage of feedback records per response value. You can, for example, see the percentage of Promoters, Passives and Detractors across the NPS metric.
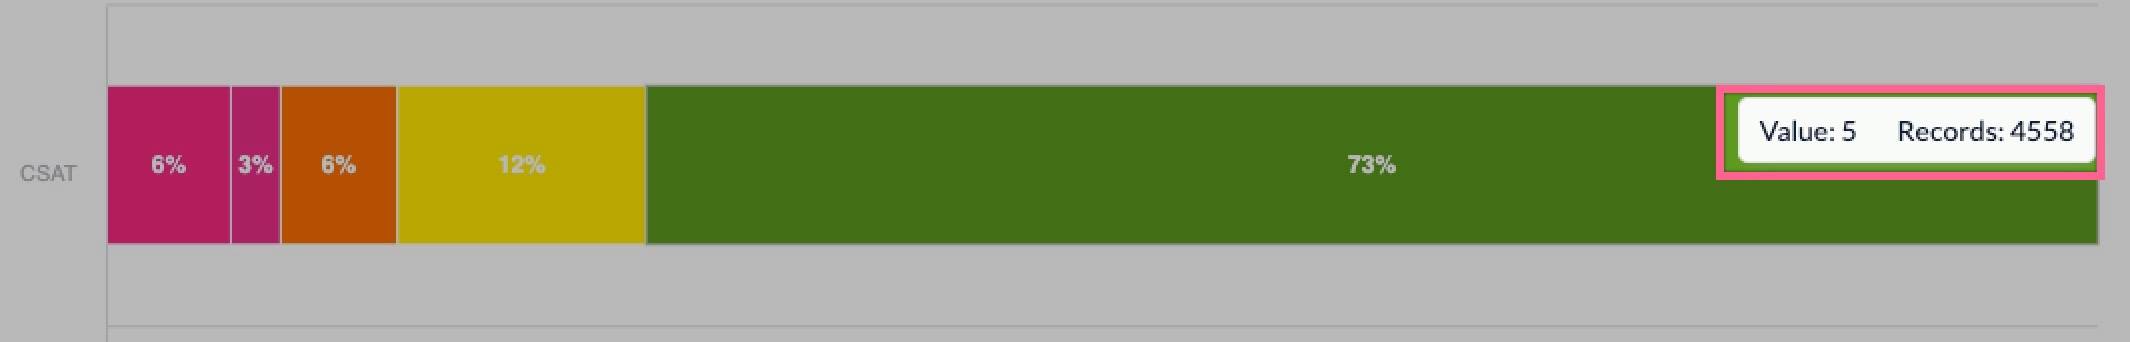
When you hover your cursor over a section of the line graph to see the respective response, you'll also see the number of responses per value:
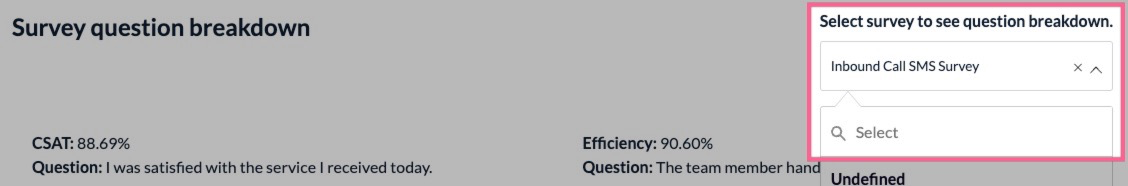
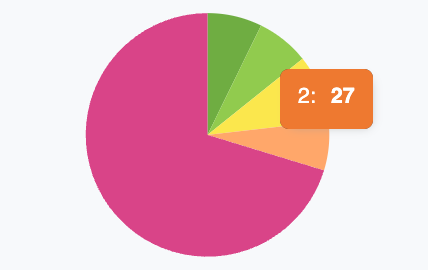
Survey question breakdown
Select a survey to view pie chart breakdowns of the response to each question:
 This is particularly useful when viewing single or multiple choice questions that do not have a value associated with the response.
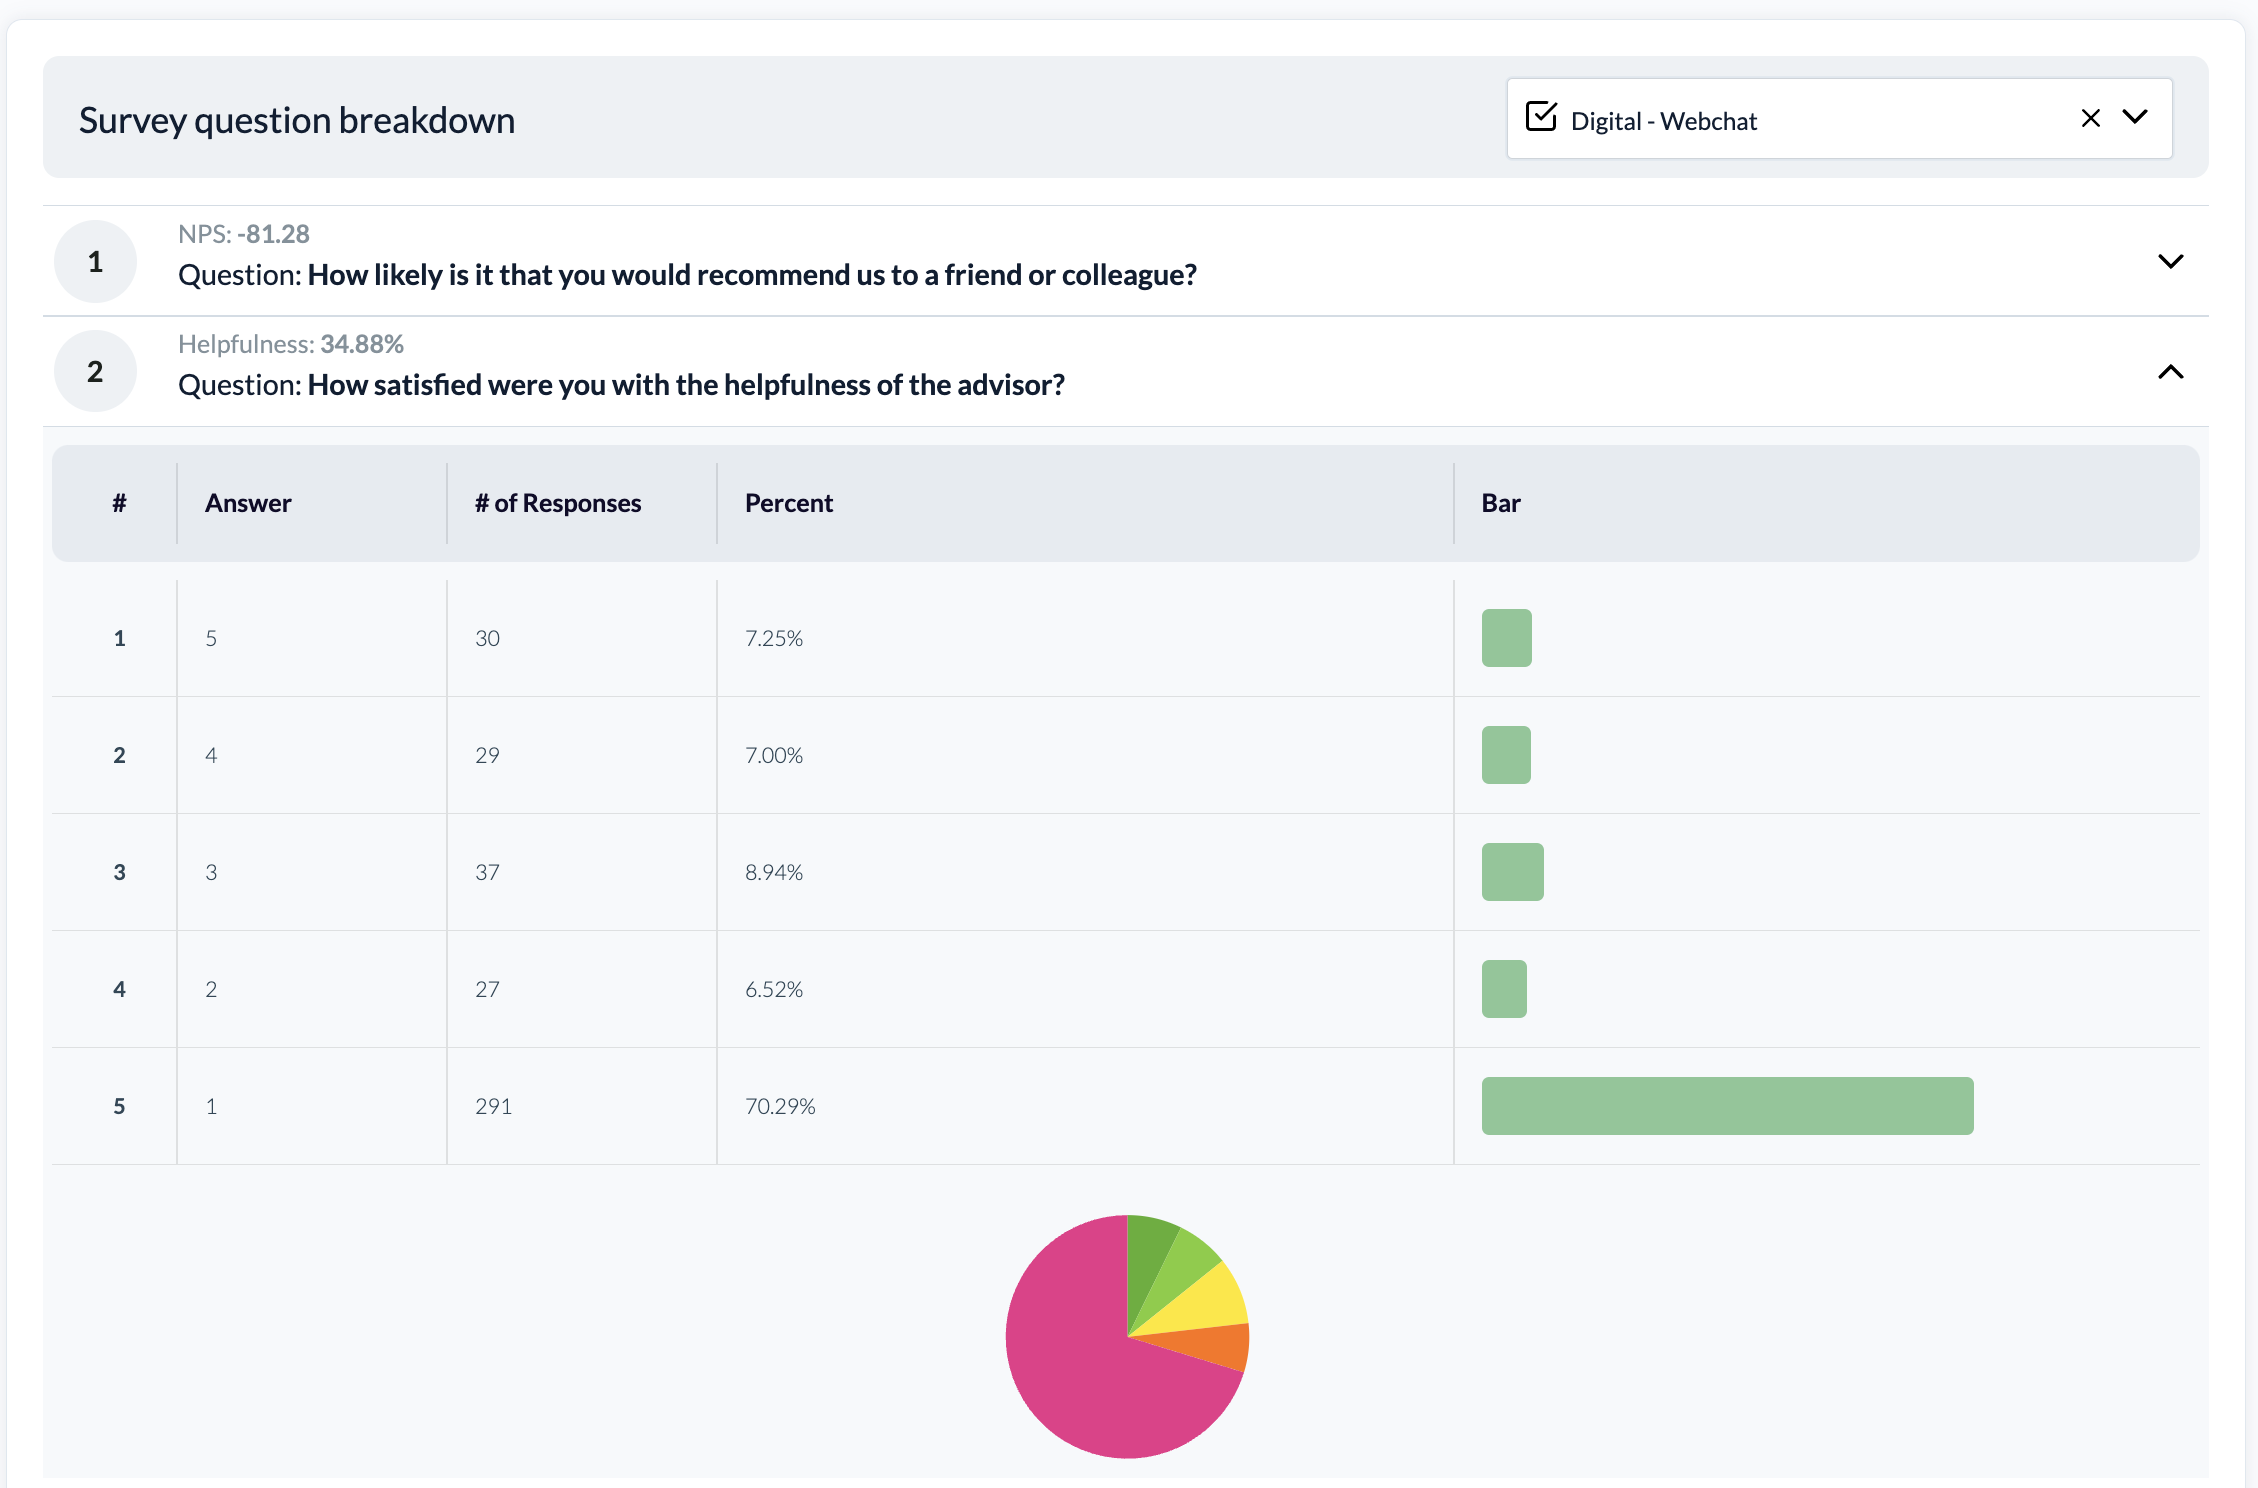
It's also very useful for Relationship surveys where you may have a higher volume of questions. When you hover your cursor over a section of the pie chart, you'll also see the number of responses per value.
Compare different parts of your org structure
This section of the dashboard can be used to:
- Compare any level of the org structure.
- Compare different metrics (depending on what the user has access to).
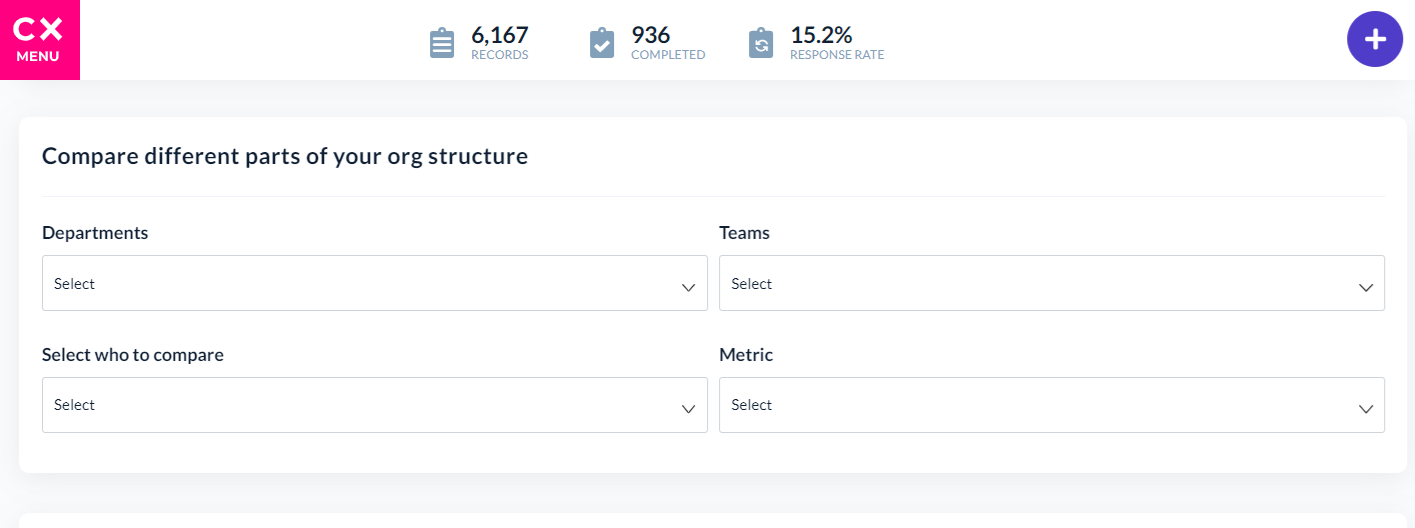
For example, a user can compare multiple teams and multiple metrics at the same time.
Use the dropdown options to select the different parts of your organisation to use in the comparison.

The results will automatically display in the chart below.
How to download the displayed graph
Click on the menu icon (three lines) on the top right corner of the graph.
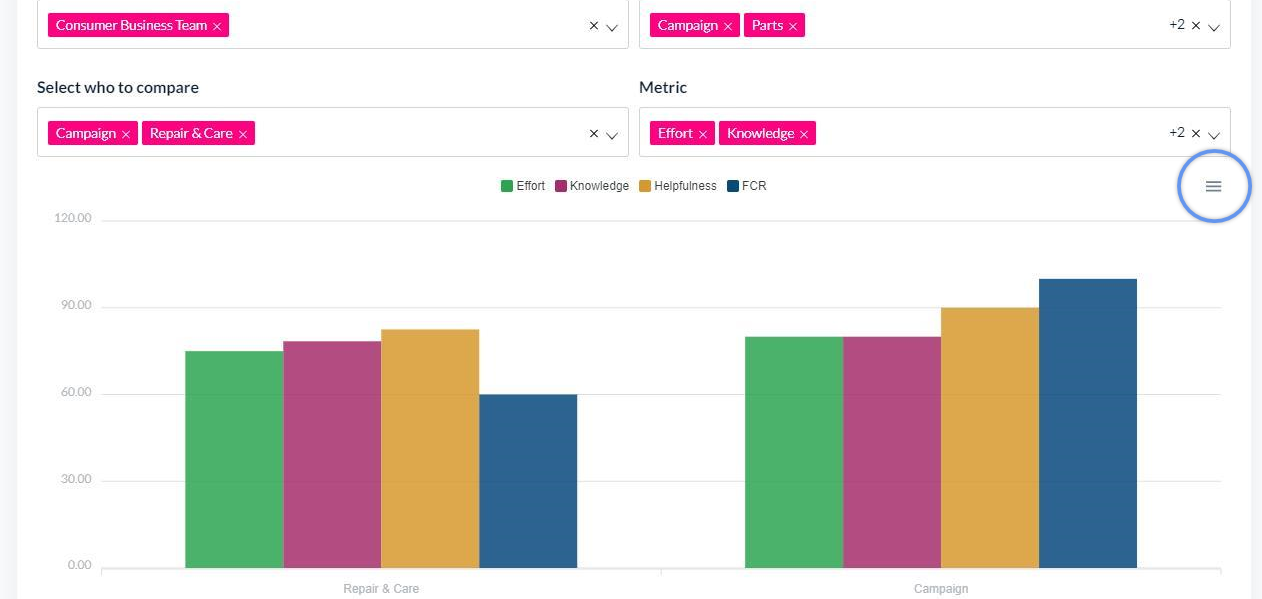
You will see 3 options. Choose your preferred download option (SVG, PNG, CSV).
Comments
This section of the dashboard displays all records with comments, including the following details:
- Create Date
- Agent
- Survey
- Customer
- Comment
- Metric
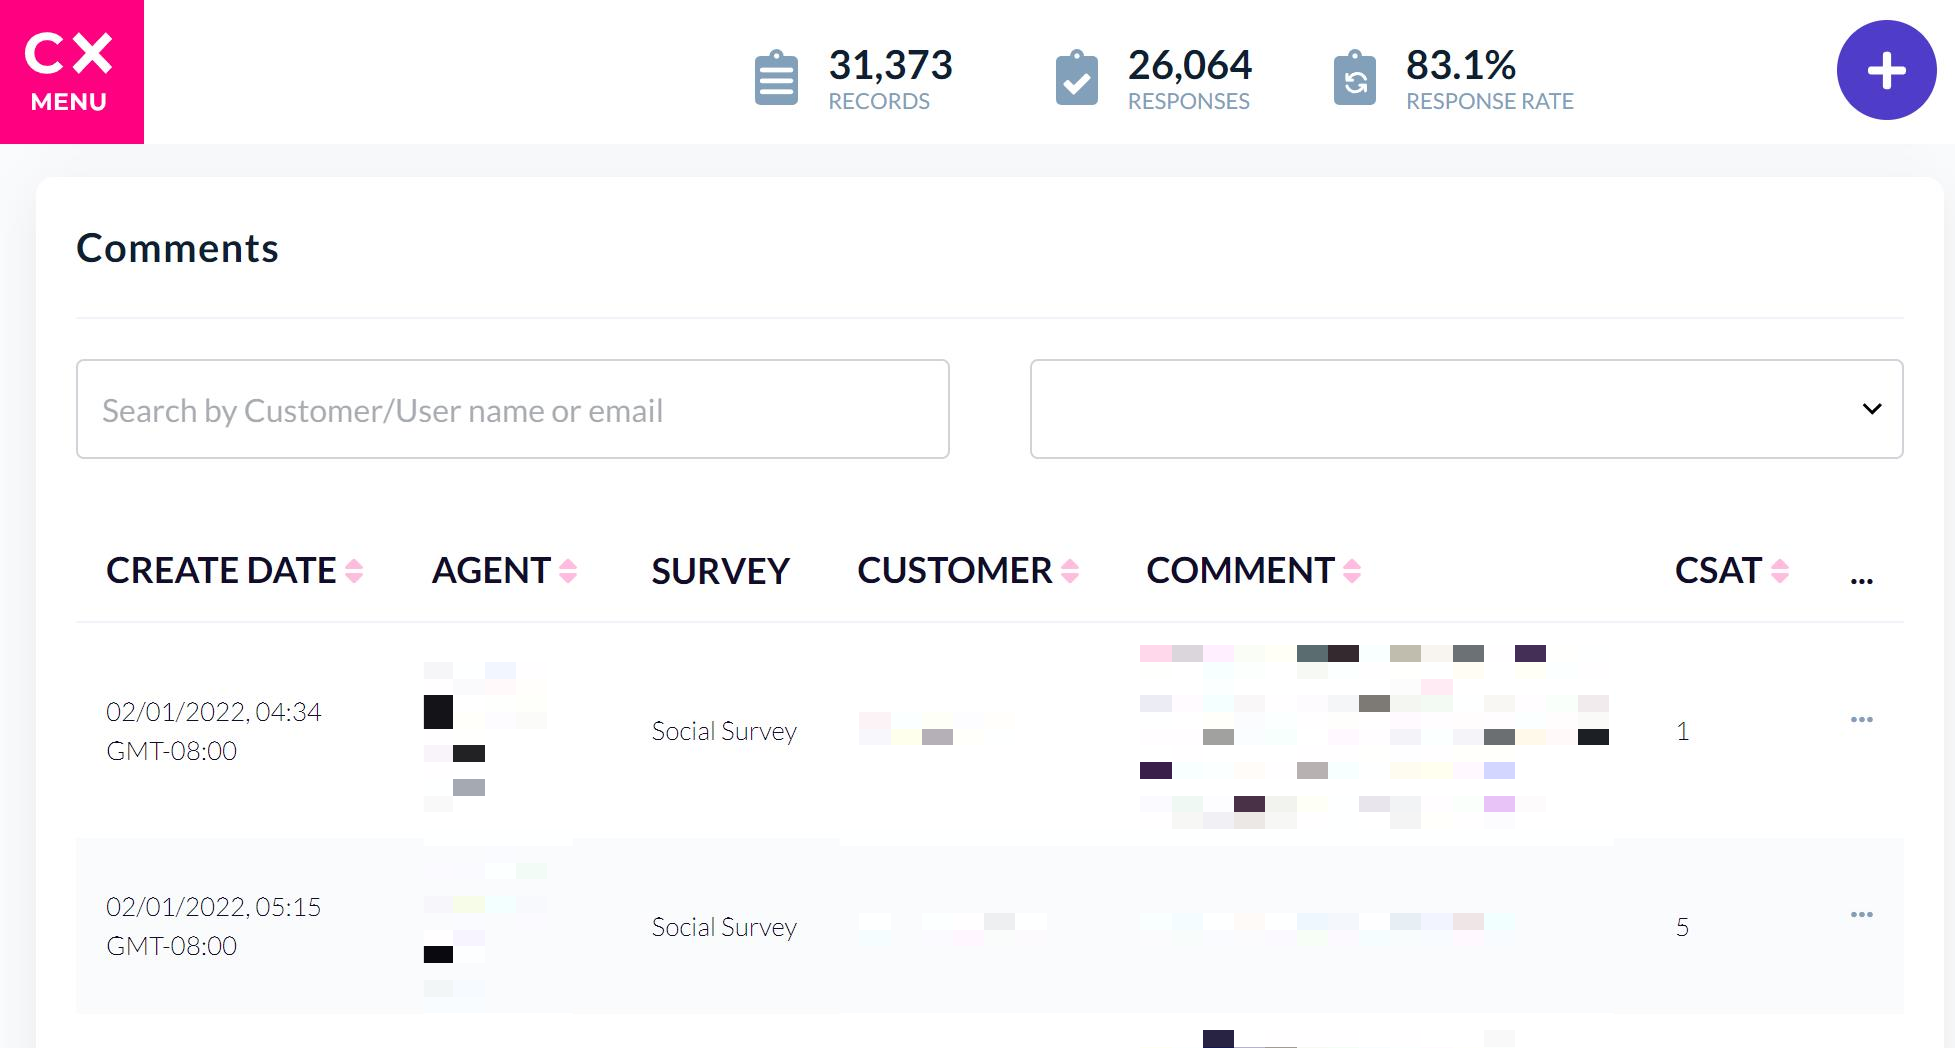
To find a specific record, use the search bar, or use the column headers to narrow the search parameters.
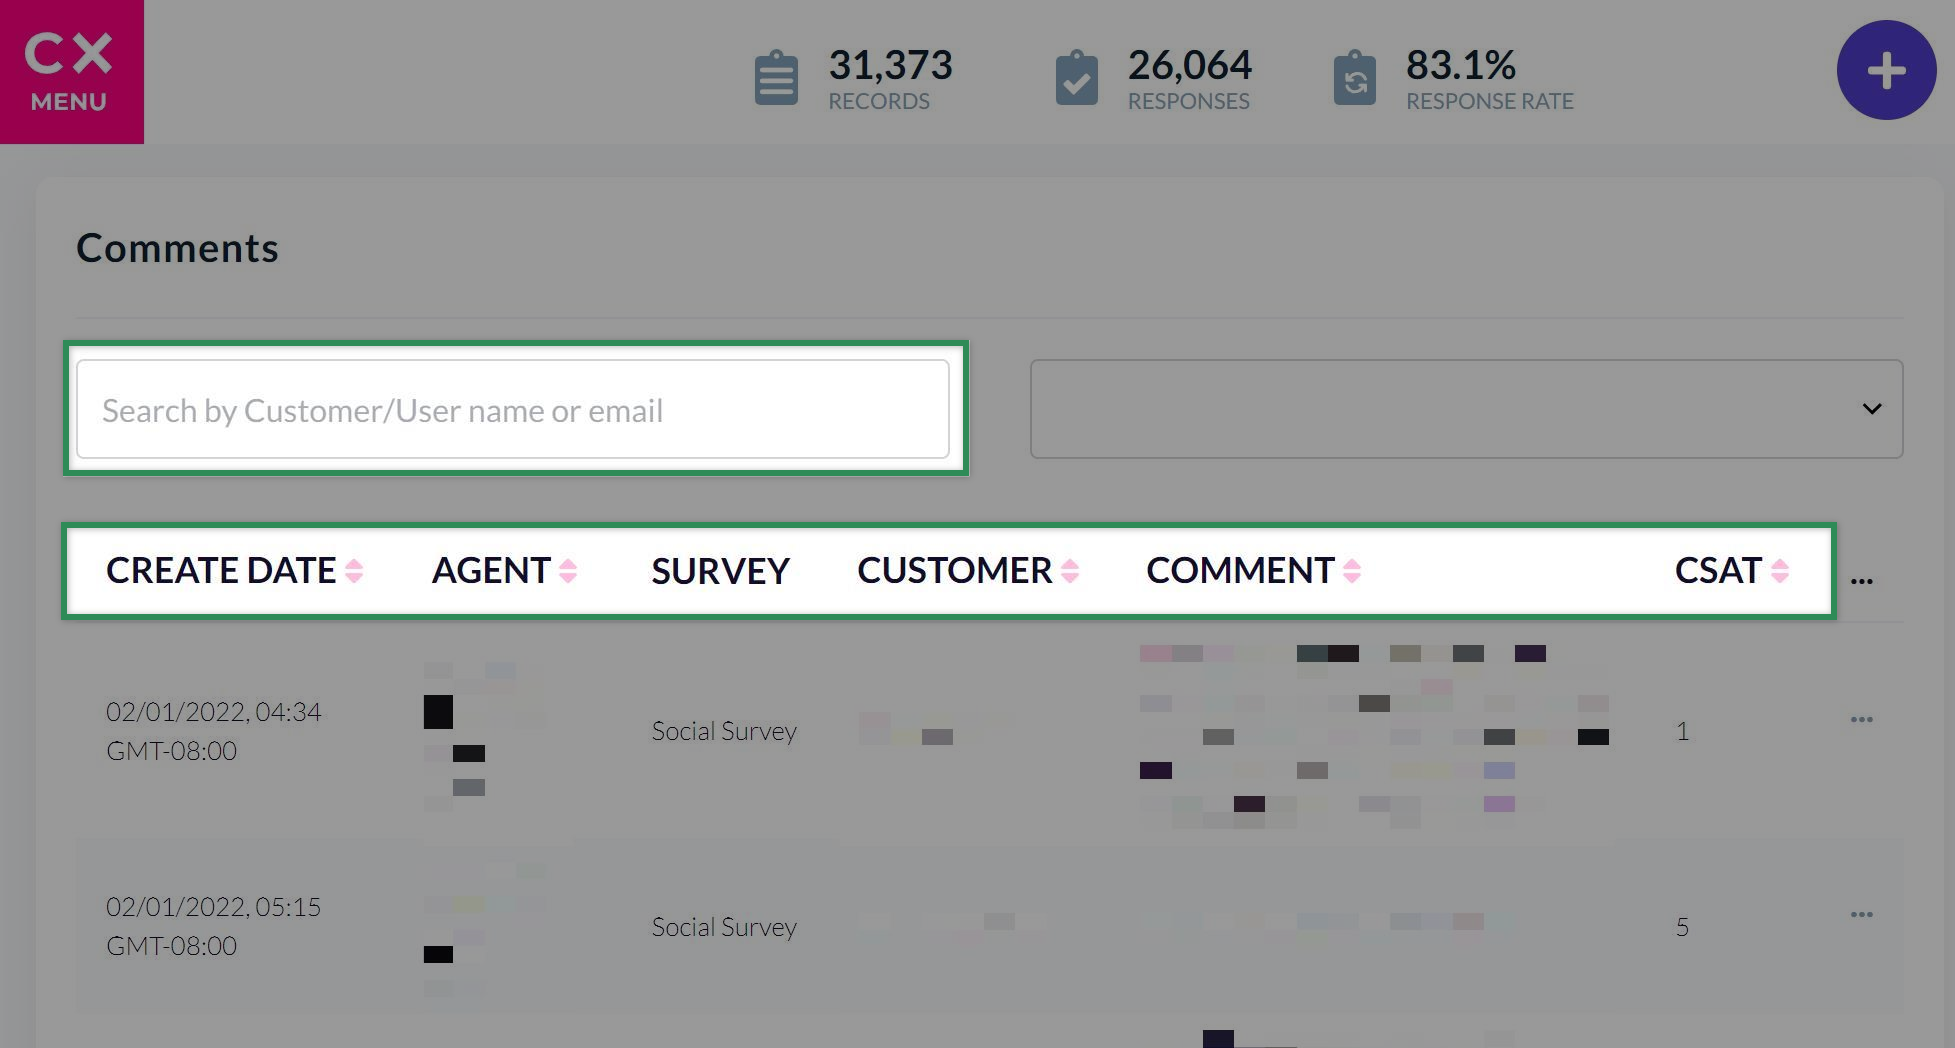
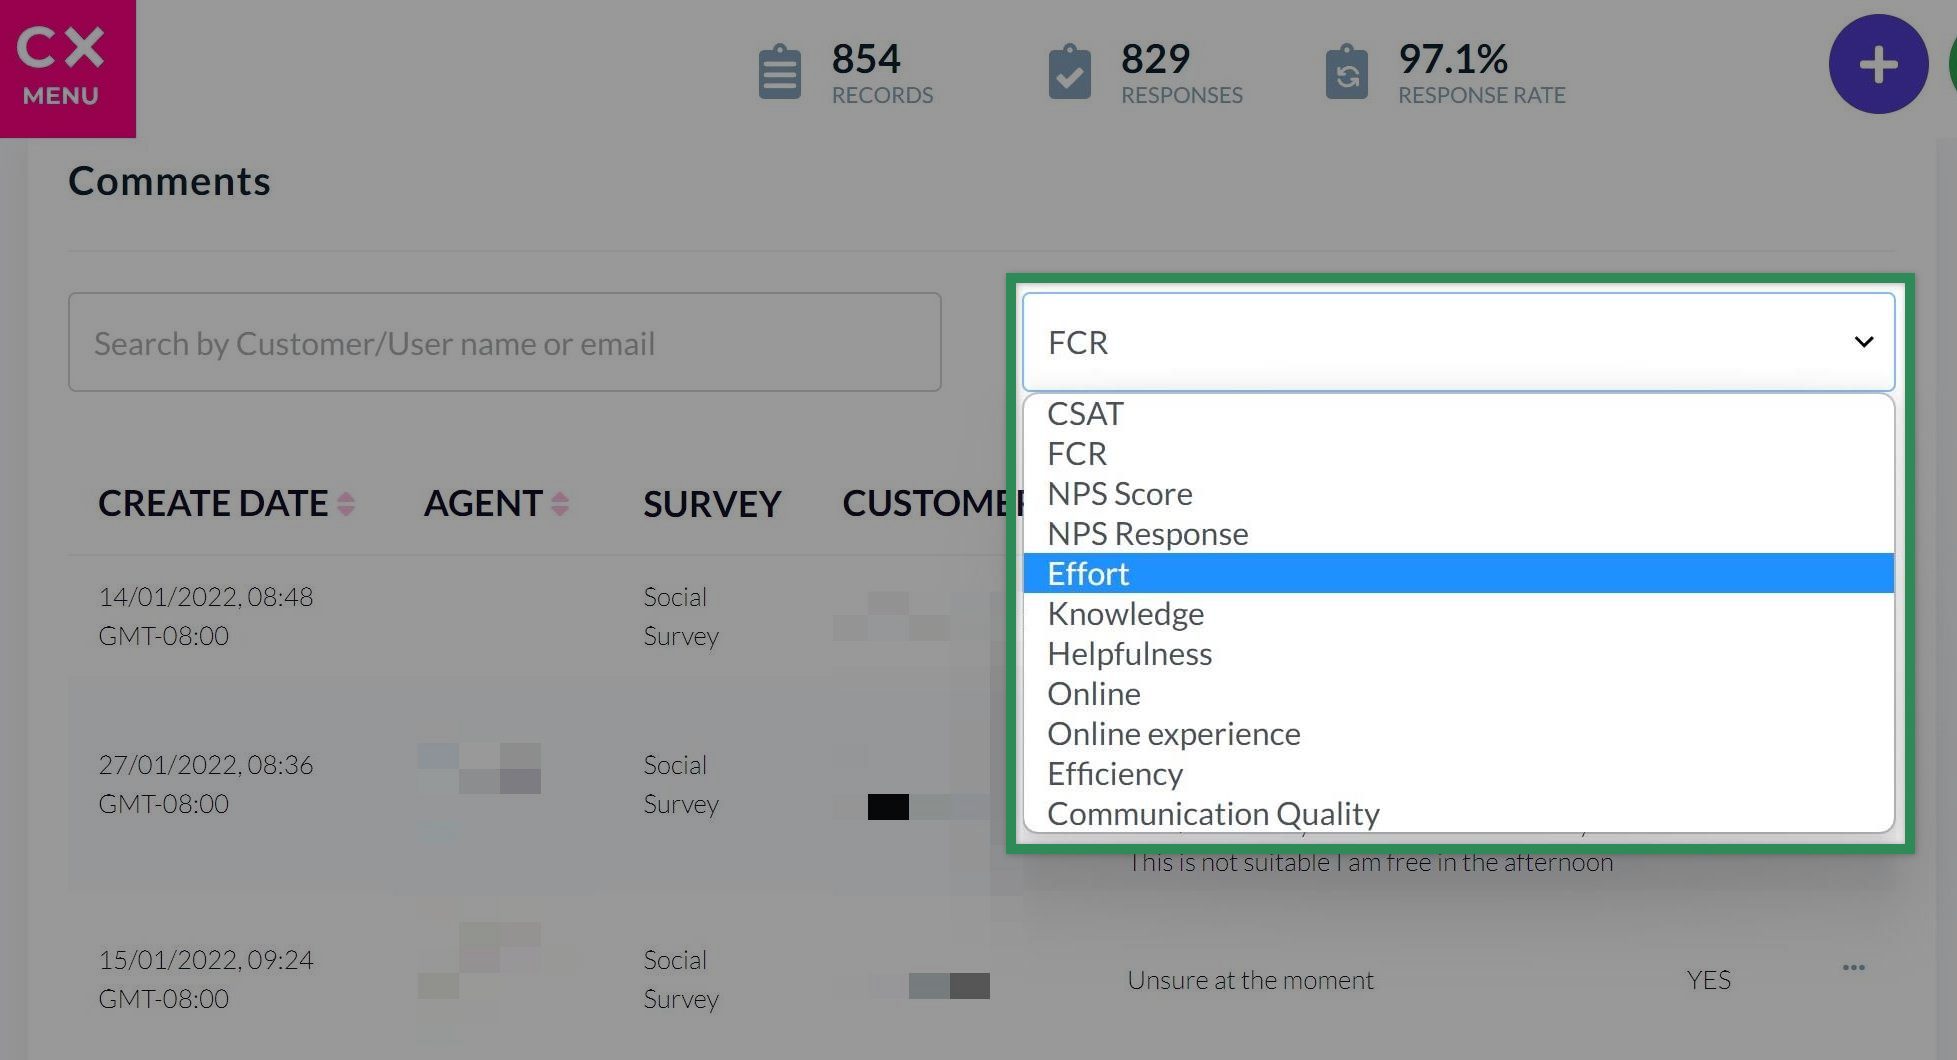
You can change which metric is displayed in the column headers using the dropdown box at the right of the page.
How to export comments
You can view and export comments, records, and users from the Feedback Records page. For more information, see the following help article: How to view comments.
How to View Response Rates
You can view the response rate from any page in the app (e.g. dashboard, feedback records) at the top of your screen.

On the Dashboard or the Feedback Records page, you can use the filter options on the right hand side to change what data you see.
You can view the response rate for a specific team or agent using the dropdown boxes at the centre of the Dashboard or the Feedback Records page.
At the top of the page you can see the response rate changes based on the selected filters.
Metrics
Metric type per graph
The different metrics (NPS, CSAT etc) contain different data variables. You can view one metric per graph, as otherwise you would not be comparing like for like.
What survey metrics can I see?
Users will only see metrics for those survey relevant to them.
Managers/team leaders will have access to their own teams’ survey metrics.
Reporting
You can create custom Reports that export data directly to your email address or SFTP directory. For more information, see the following help articles:
- To learn about the types of reports available, see: Different Report Types
- To learn how to schedule reports directly to your email address or SFTP directory, see: How to configure reporting: Scheduling reports.