When configuring the pages of a report, the required fields/parameters depend on the chart type chosen from the Chart dropdown.
It is important to set up your chosen chart type using the right combination of field selections, in order for the report to be correctly generated. These fields are:
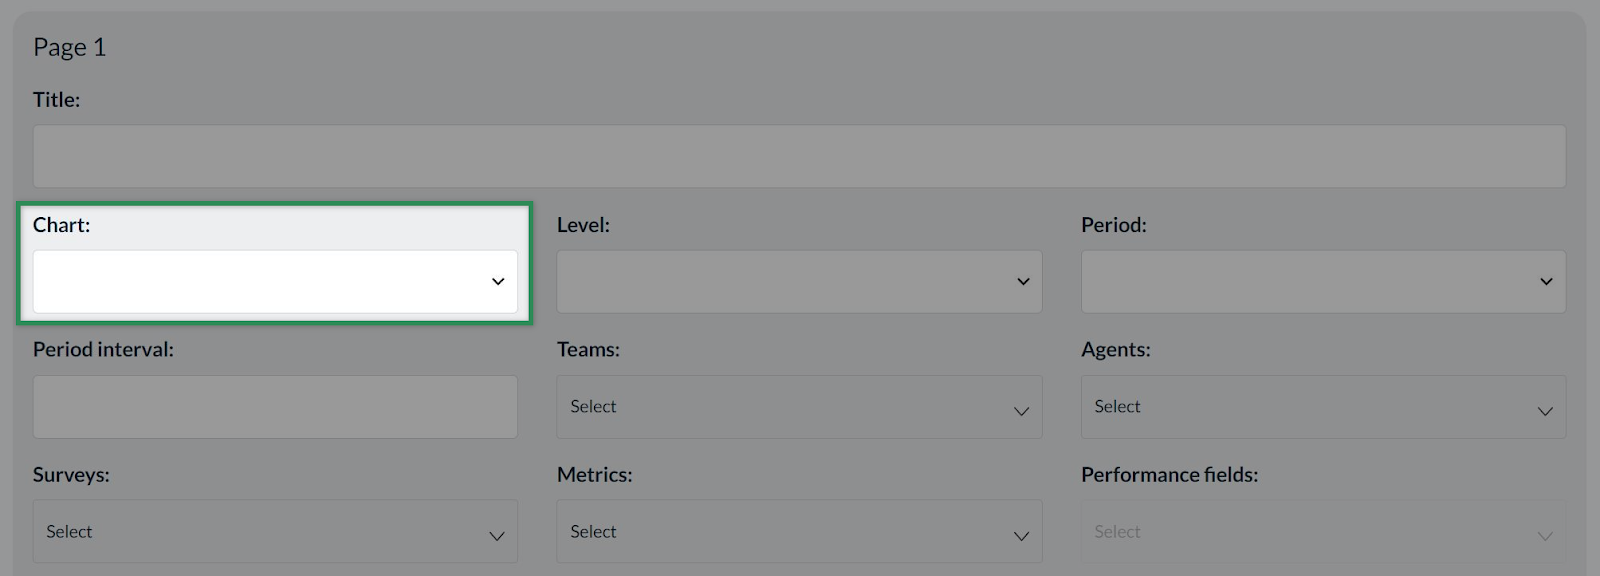
| Level | Organisational level to be presented. Options are Agent, Team, Survey, Metric, Response, or Custom. |
| Period | The time period by which data will be displayed i.e. data relating to a particular day, month, etc. Options are Day, Week, Month, Year, or Total. |
| Period interval |
The number of periods you would like to go back to extract data from. For example, if the period is set to Month, and it is currently January:
|
| Org entities (Teams and Agents) | Select the required entities by checking the relevant checkbox. |
| Surveys | Select the required survey(s) by checking the relevant checkbox. |
| Metrics | Select the required metric(s) by checking the relevant checkbox. |
| Performance fields | Used for creating reports from CX-Ops data. |
Chart Types and Field Selections
The section below describes each chart type and its required fields/parameters.
Note that Period and Period interval are required fields for all chart types.
Powerpoint and PDF Charts
|
Summary report Summary PDF report that will give any stakeholder in your business an overview of the scores you are receiving. Can be grouped by team, user, survey, or metadata field (I.e., client, country). |
|
Count of Scores Required fields: Level, Teams/Agents, Surveys. |
|
Matrix Chart Required fields: Level, Teams/Agents, Surveys. |
|
Movement of One Factor graph Required fields: Level, Teams/Agents, Surveys, Metrics. |
|
Movement of One Question graph Required fields: Level, Teams/Agents, Surveys, Metrics. |
|
NPS Response Distribution - by Grade Required fields: Level, Teams/Agents, Surveys. |
|
NPS Summary Graph - by Entity Required fields: Level, Teams/Agents, Surveys. |
|
NPS Summary Graph - by Survey Required fields: Teams/Agents, Surveys. |
|
Single Factor with 1-5 Score Distribution - By Entity Required fields: Level, Teams/Agents, Surveys, Metrics. |
|
Single Factor with 1-5 Score Distribution - By Survey Required fields: Teams/Agents, Surveys, Metrics. |
|
Single Question Pie Chart Required fields: Teams/Agents, Surveys, Metrics. |
|
Single Question Summary - By Entity Required fields: Level, Teams/Agents, Surveys, Metrics. |
|
Single Question Summary - By Survey Required fields: Teams/Agents, Surveys, Metrics. |
|
Single Question Summary Benchmark Required fields: Metrics. |
|
Single Question Summary - By Weekday Required fields: Level, Teams/Agents, Surveys, Metrics. |
|
Summary graph over multiple factors - By Entity Required fields: Level, Teams/Agents, Surveys, Metrics. |
|
Summary Graph over multiple questions - By Survey Required fields: Teams/Agents, Surveys, Metrics. |
|
Summary Graph With One Performance Metric Required fields: Level, Teams/Agents, Metrics. |
|
Top Entities Table per Factor or Performance Metric Required fields: Level, Teams/Agents, Surveys, Metrics. |
|
Trend Graph Over Multiple Factors Required fields: Teams/Agents, Surveys, Metrics. |
|
Trend Graph over Multiple Questions Required fields: Teams/Agents, Surveys, Metrics. |
|
Trend Graph Over One Performance Metric Required fields: Level, Teams/Agents, Metrics. |
Excel and CSV Charts
|
Table with Social Messages - Summary
|
|
Table with Social Messages
|
|
Table with Response Rates Required Fields: Levels, Teams/Agents, Surveys |
|
Table report No Required Fields (custom report). |
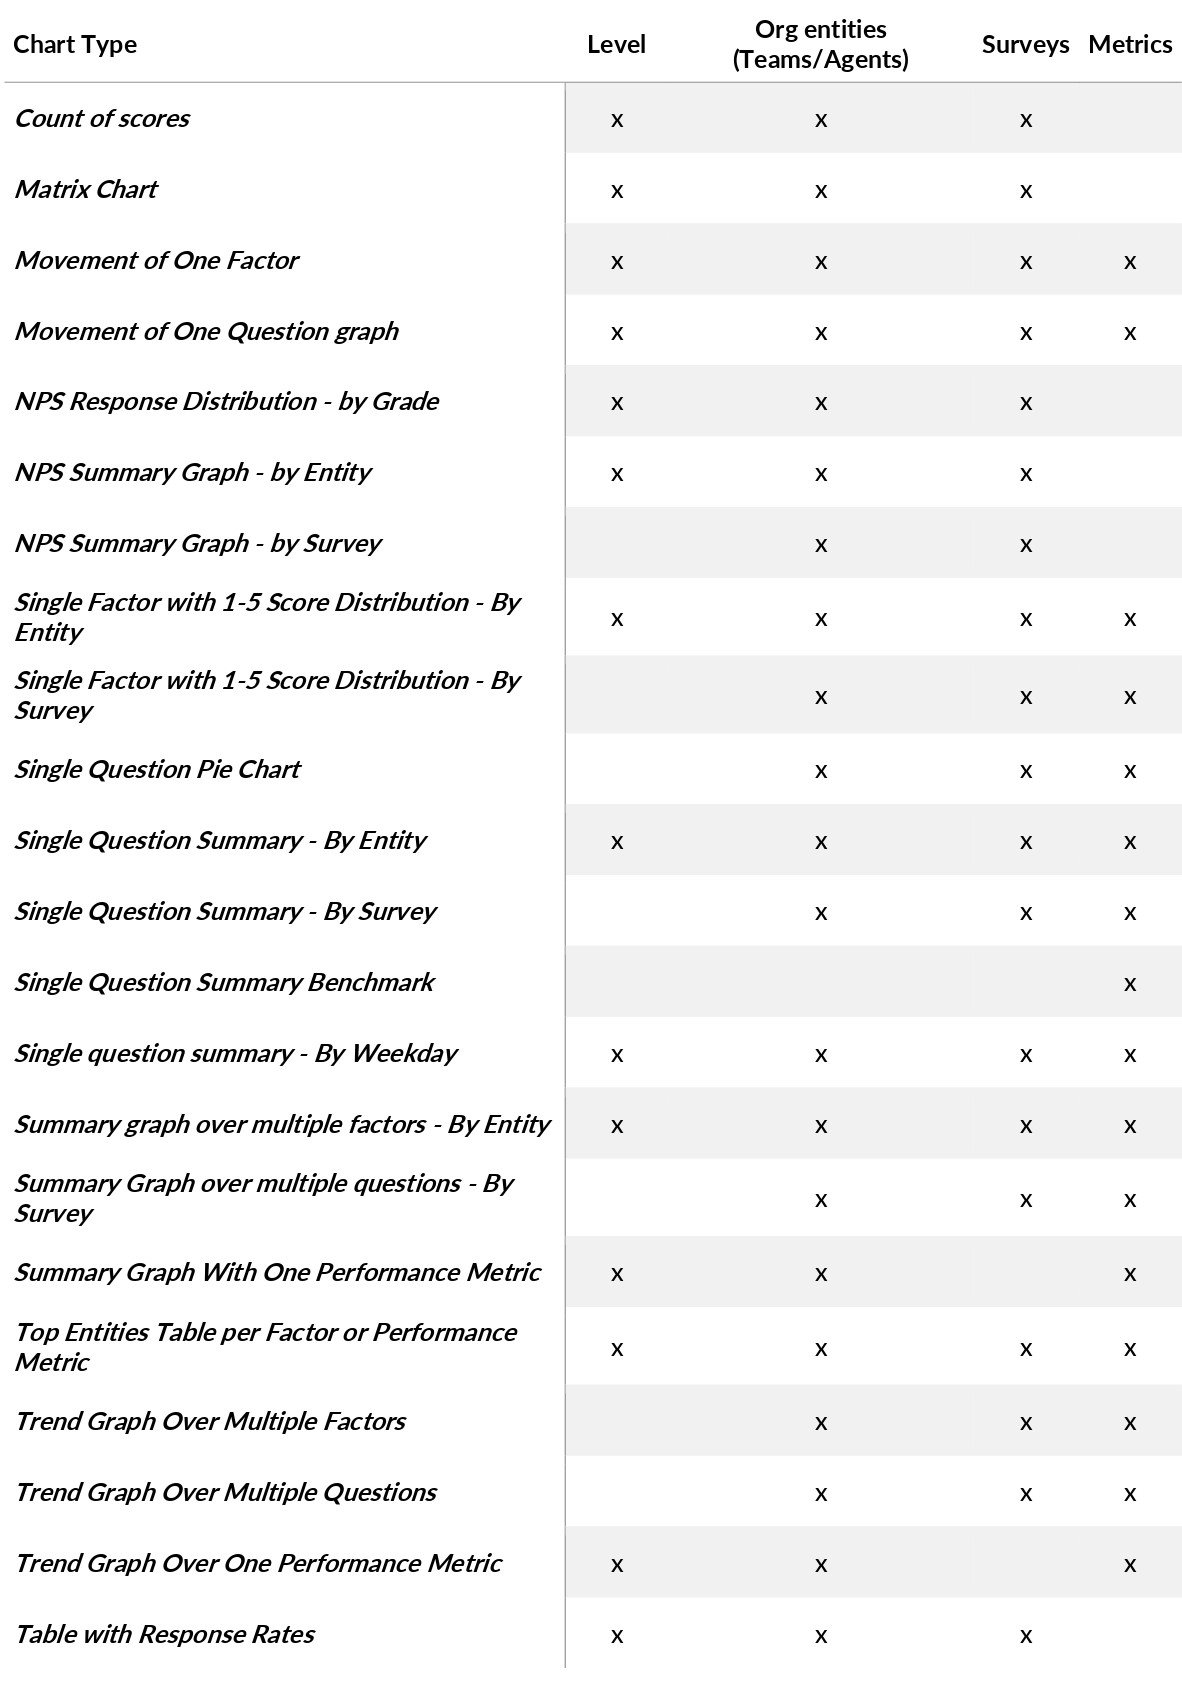
Field Selections summary
The table below shows a summary of what fields/parameters need to be made available when setting up a report with each chart type. An ‘x’ means this field is required for the relevant chart type.
Note that Period and Period interval are required fields for all chart types.