Instant Report Generation
With CX Index’s Reporting functionality, you can instantly generate reports and visualisations for your business.
- Our system automates these reports, so you don’t have to worry about working on spreadsheets or manually inputting data.
- Reports can be automatically scheduled:
- Daily,
- Weekly,
- Monthly,
- Quarterly, or
- Annually.
Once generated, you can send the report:
- to your FTP,
- to your email addresses,
- or both.
Create reports based on data from teams, agents, surveys or metrics.
For example, you can:
- compare the average NPS score of two teams, or
- the distribution of responses for a particular survey.
Our reporting tool provides easy-to-read tables and graphs that provide this kind of information, with minimal effort on your behalf.
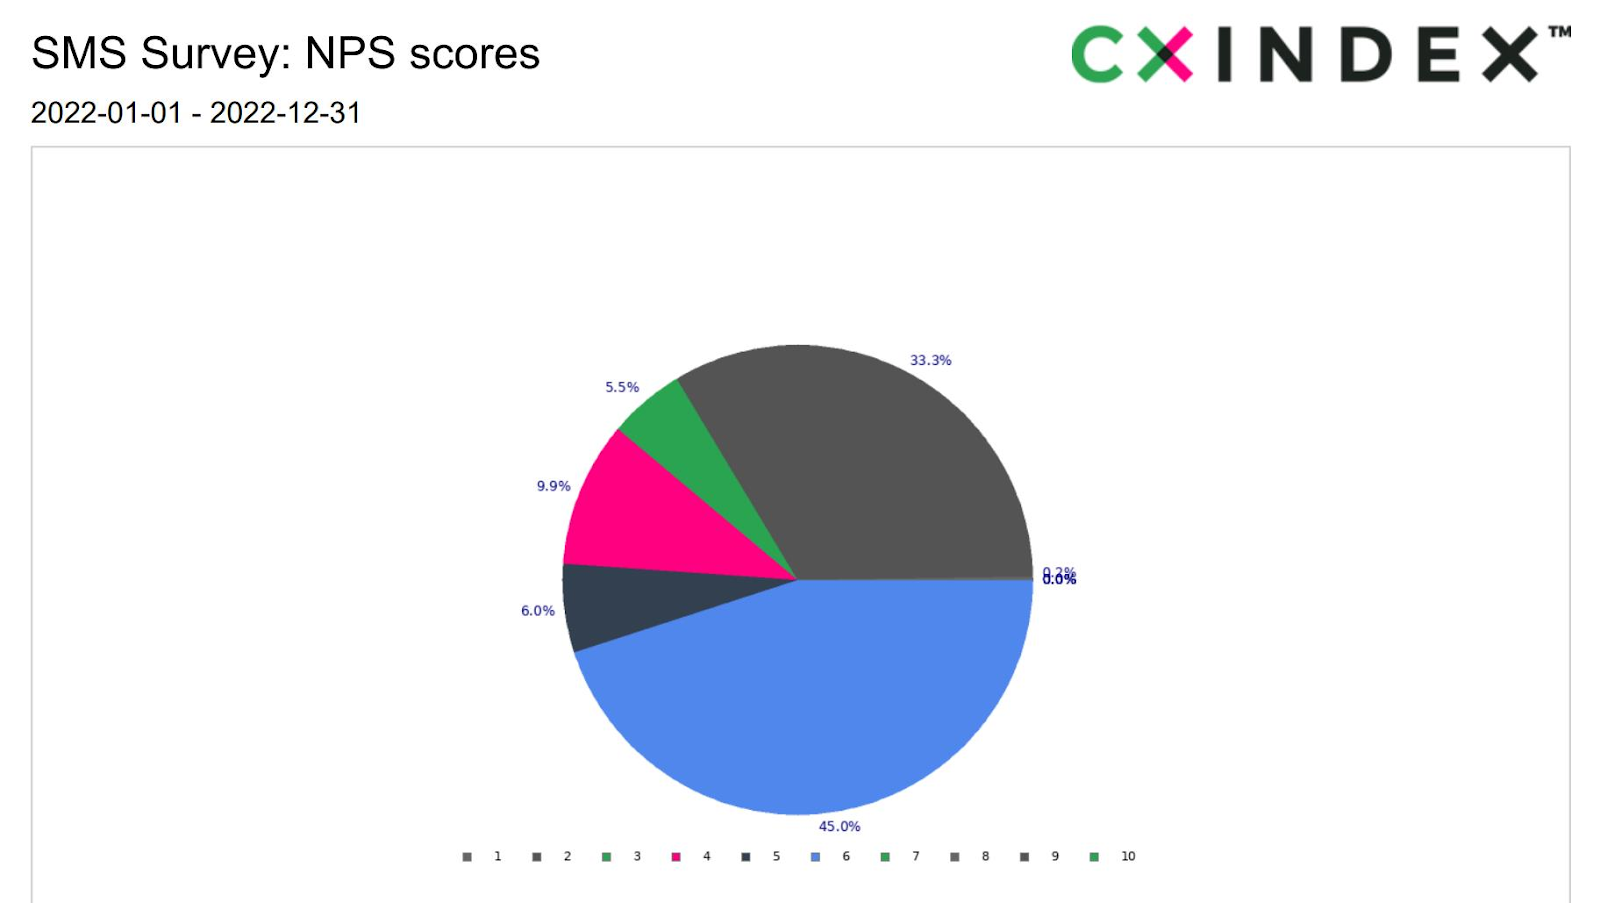
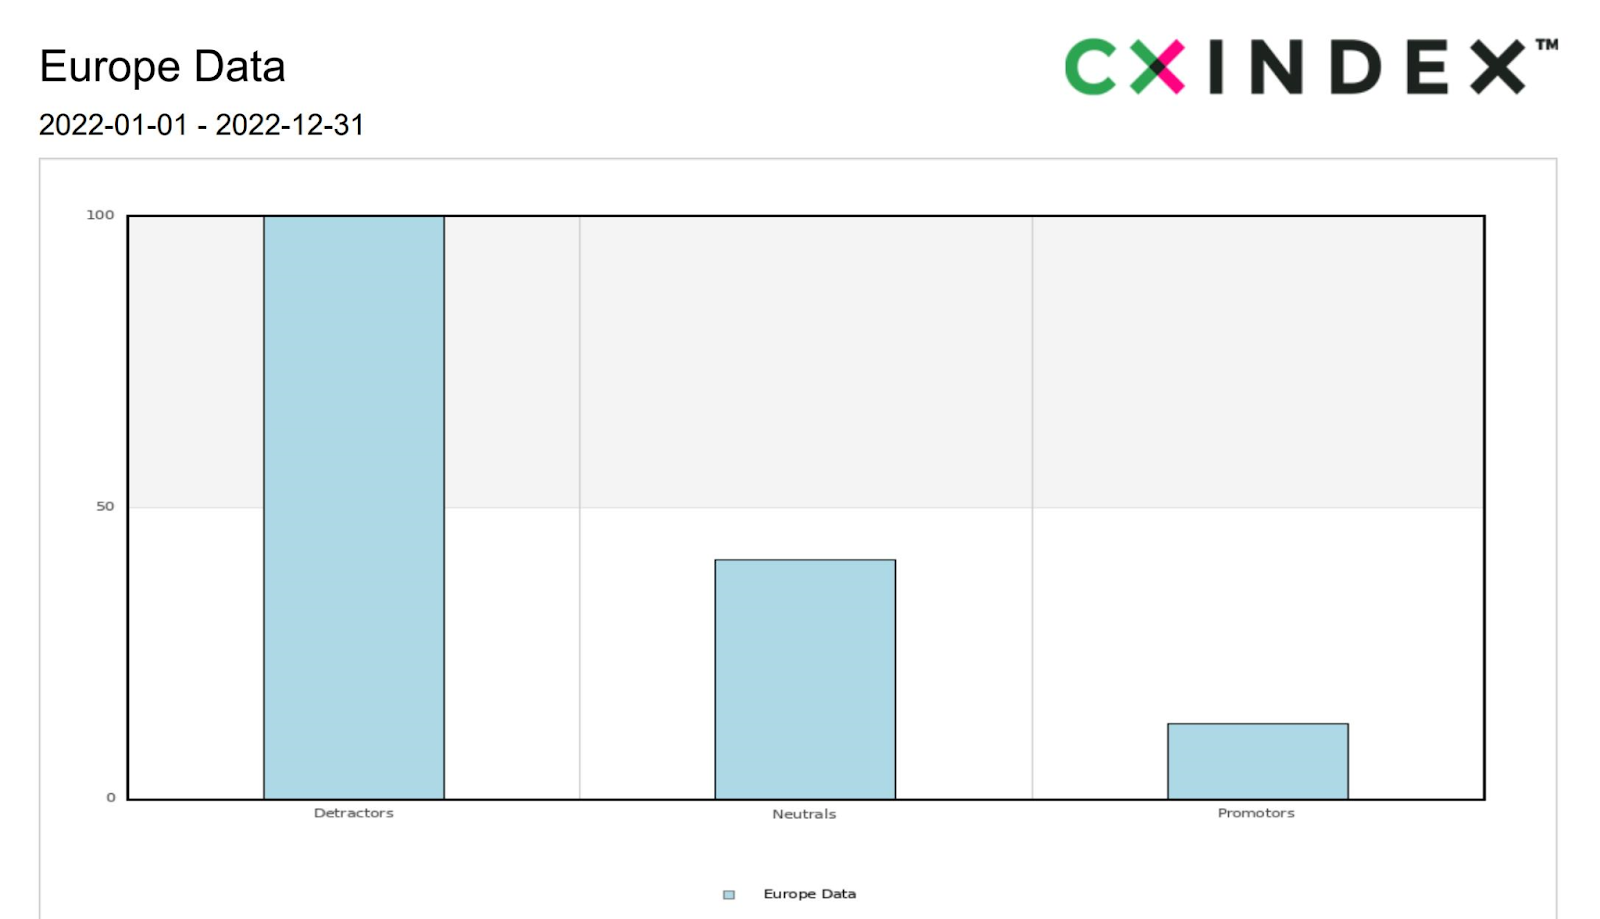
You can choose from a range of chart types to display data - tables, trend graphs, bar charts, pie charts, matrix charts and more.
Reports can be downloaded as your preferred file type - CSV, XLS, PDF or PPT.